
Editorial note: This guide is published as advertorial content. We may earn a fee if you continue to a partner site. Always confirm eligibility, exclusions, and pricing before you buy.
Payback timelines for UK rooftop solar depend on generation, how much you use at home, export income, and what you paid upfront — not on billboard averages.
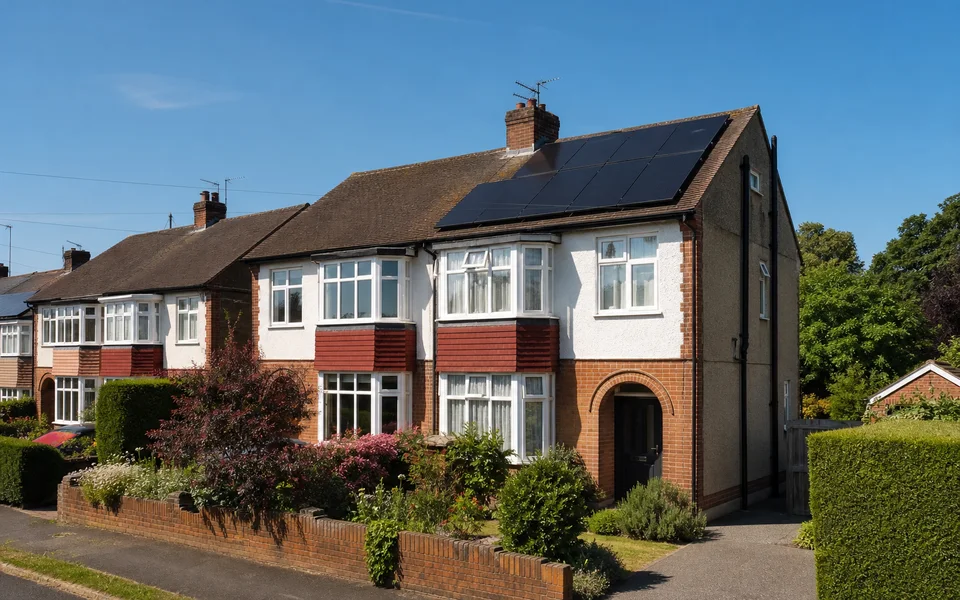
What you actually pay upfront
A typical 3.6–4 kWp system on a semi-detached roof in England might cost £6,500–£9,500 installed in 2026, including scaffolding, MCS certification, and VAT at zero rate for qualifying domestic installations. Quotes vary with panel tier, inverter type, roof complexity, and whether you add a battery. Always ask for itemised breakdowns: hardware, labour, scaffolding, and any DNO upgrade fees.
Finance spreads the cost but adds interest — model total repayments against expected bill savings, not just the monthly figure on the brochure.
Realistic annual generation
MCS estimates use postcode irradiance data. A 4 kWp array in southern England might produce 3,800–4,200 kWh per year; the same system in northern Scotland might see 3,000–3,400 kWh. Orientation, pitch, shading, and inverter efficiency all shift the number. Treat the installer's estimate as a planning figure and compare it against your first full year of meter readings.
| Roof factor | Typical impact on output |
|---|---|
| South-facing, 30–40° pitch | Baseline for estimates |
| East/west split | 5–15% below south for same capacity |
| Partial shading | Can cut output sharply without optimisers |
| Steep north pitch | Often poor economics unless other factors compensate |
Self-consumption vs export
Electricity used at home avoids buying at retail rates — often 24–30p/kWh for many households in 2026. Surplus exported to the grid earns Smart Export Guarantee (SEG) payments, typically lower per kWh. A home that uses 40% of generation on-site saves more than one that exports 70%, even if both arrays produce identical kWh.
- Estimate daytime load: working from home, retired, or out all day?
- Shift flexible loads — dishwasher, washing machine, EV — to sunny hours.
- Compare SEG rates from multiple licensed suppliers before signing.
- Model payback with and without battery storage.
Simple payback maths
Divide net upfront cost by annual benefit (bill savings plus SEG income minus any finance interest). Example: £7,500 system, 3,900 kWh/year, 45% self-consumed at 27p, 55% exported at 15p → roughly £470 + £320 = £790 annual benefit → payback near 9.5 years before degradation. Add a £4,000 battery and the maths lengthens unless time-of-use tariffs or high evening use justify storage.
Payback is a household spreadsheet, not a billboard promise. Your roof, tariff, and habits matter more than national averages.
Battery trade-offs
Batteries store midday surplus for evening use and can reduce grid dependence. They add upfront cost and may extend payback unless you are on time-of-use tariffs, charge an EV overnight from stored solar, or face weak SEG rates but high retail prices. For many homes, improving usage habits beats battery spend initially.
Grants, VAT, and policy shifts
Direct household grants for solar have shifted over recent years. Zero-rate VAT on qualifying domestic solar installations has applied for many households — verify current GOV.UK guidance before signing. Local authority schemes appear and disappear; eligibility changes with policy.
Choosing an MCS installer
MCS certification is required for SEG registration and consumer protections under the Renewable Energy Consumer Code. Compare three written quotes with panel brand, inverter model, warranty lengths, and scaffolding line items. Avoid pressure to sign same-day — reputable firms allow comparison time.
Your next step
If you have a roof survey and rough usage figures, the remaining uncertainty is usually how your household profile maps to typical payback bands. Use the short questionnaire below to see whether your roof orientation, shading, and daytime use fit common payback scenarios — then confirm numbers with itemised quotes before committing.
Generation varies annually with weather; revisit assumptions after year-one meter readings. Figures are illustrative — not personal financial advice.
